3D Models of Zacaton from Depthx Project


Original point cloud sonar data.

sonar point cloud by Reuben Reyes
Image VRML Color Scale


Gridded transparent surface with center line.

transparent surface with center line by Reuben Reyes
White center line was used to create surface grid from point cloud sonar data.
Image VRML.


True center line from gridded surface (looking down).

True center line from gridded surface by Reuben Reyes
Image VRML Color Scale Excel stats


Image map with 5 sections.

Image mapped surface by Reuben Reyes
Each section is made up of images taken at the depth listed.
Image VRML 5 Pics


Probability map on surface.

Probability map on surface by Reuben Reyes
This shows the distance from the closest sonar point from the point cloud to the gridded surface.
Image VRML Chart Excel Histo


Horzontal features on surface.

Horzontal features by Reuben Reyes
Filter used a 12 meter up and down search.
Image VRML Color Scale


Vertical features on surface.

Vertical features by Reuben Reyes
Filter used a 12 meter side search.
Image VRML Color Scale


Horizontal area at 1 meter depth intervals.

Horizontal area at one meter depth intervals by Reuben Reyes
Image VRML Color Scale Excel


Work in progress.
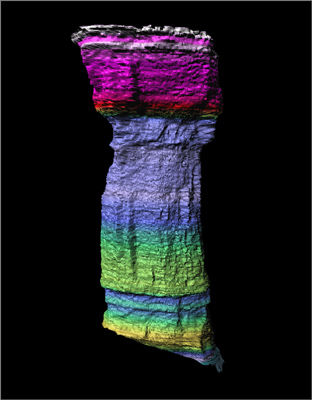
Research by Dr. Marcus O. Gary and Reuben Reyes.

How to view VRML models?
You will need a VRML viewer or VRML client for your browser in order to view VRML models.
For Windows use Cortona, Blaxxum, Octaga or Cosmo.   For Mac OS X use Cortona.   For SGI Irix use Cosmo and for Linux use Octaga.


 ParallelGraphics
Cortona

 Blaxxum
3D Viewer

 Cosmo
Player

 Octaga
Player


Mirror