An Interactive Desalination Dataset of the US from 1950 to 2013
Research by Reuben Reyes and Jad R. Ziolkowska
Here you will find an interactive Google Earth tool, created by researchers
from the University of Oklahoma that visualizes the history and growth of over
1,600 desalination plants across the United States from 1950 to 2013. The tool
utilizes a 3D map by representings elevation as time, with higher, more recent
developments located above older infrastructure, primarily highlighting trends
in Florida, California, and Texas. The tool also seamlessly allows viewing of all
desalination plants (1950 to 2013) across the whole United States and to switch
between "Plant Status", "Raw Water Type", and "User Category" easily. This site
includes a free downloadable file "US_Desla.kmz" for use in Google Earth or in
any Virtual Earth viewer. The downloadable file US_Desal.kmz can also be viewed
for how different KML techniques are used in multi-dimensional data structures.
Supplemental information for this paper:
Geospatial Analysis of Desalination in the US -
An Interactive Tool for Socio-Economic Evaluations and Decision Support
doi:10.1016/j.apgeog.2016.04.013
Below are links to 2 movies made by using US_Desal.kmz
CesiumJS movie (mp4 format with background music).
Googel Earth movie (mp4 format no sound).
The map US_Desal.kmz is for viewing and learning purposes only.
The map file US_Desal.kmz should not be used for anything else
without written permission from the authors Jad Ziolkowska or Reuben Reyes.
The US_Desal.kmz file is based on selected data from Desaldata.com.
This data was modified by the authors and made into a structured KMZ
map with permission from Desaldata.com. The code and example structures
in the KMZ file are free to use but not the data.
You will need Google Earth or some other virtual globe to view this KMZ file.
We recommend using Google Earth if you dont have it installed here is a link:
Google Earth application for download and installation.
Below is a link is to map US_Desal.kmz file for use in Google Earth.
US temporal desalination plants map US_Desal.kmz
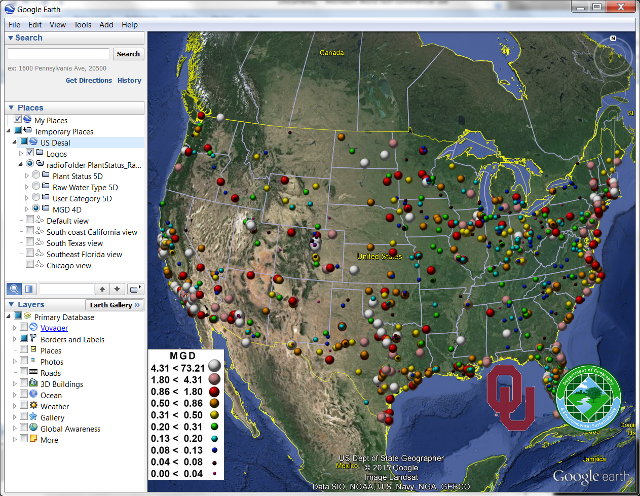
Below is a default view after loading map US_Desal.kmz
This is a map of US Desalination plants over time. Data points in the map are displayed
by height by year. The closer (lower) to the surface the older the plant and the higher
the plant the more recent. To better view plants by elevation the map must be tilted.
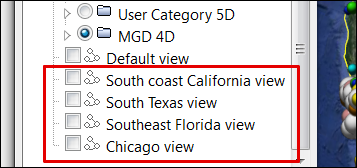
Four views are provided in the US_Desal.kmz file to view plants over time (temporal)
with a tilted view. The views are listed at the bottom of the sidebar and provide fly
throughs to California, Texas, Florida, and Chicago.
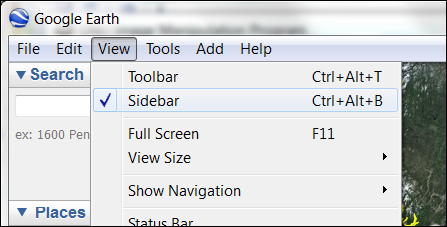
Instructions on how to navigate after loading map file US_Desal.kmz:
Make sure you have Sidebar selected.
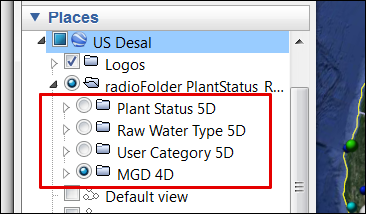
From the slide bar you can switch to Plant Status 5D, Raw Water Type 5D,
User Category 5D, or the default MGD 4D circle selector.
To change from the default view select any view below
Default view
by double clicking any part of the text name in the view.
The design and construction of the KML/KMZ file was setup to allow easy
access to more details within each data folder. We set up many folders
with multiple levels of subfolders to allow deeper folder level access
and selection control of what desal plants are visible on the map.
The core of the desal data is contained within a radioFolder. For this data
set we have 4 folders ( Plant Status 5D, Raw Water Type 5D, MGD 4D ).
The radioFolder type only allows one folder at the base level to be selected.
Within each radioFolder are more sorted levels of detail. For example
if "Plant Status 5D" is selected this has 8 subfolders (Cancelled,
Construction, Offline, On Hold, Online, Planned, Presumed Offline,
Presumed Online) and at this level and beyond folders can be selected on
or off by check box. Each of the 8 subfolders also have an additional 10
subfolders of MGD (Millions of Gallons per Day) sorted by the lowest MGD
to the highest MGD.
For example if you wanted to show only "Plant Status 5D" and only plants
that were "Online" and only the plants with the largest MGD output
"MGD range: 4:31 to 73.21" you could select only the subfolder "Online" and
only the subfolder "MGD range: 4:31 to 73.21" as in the example below.
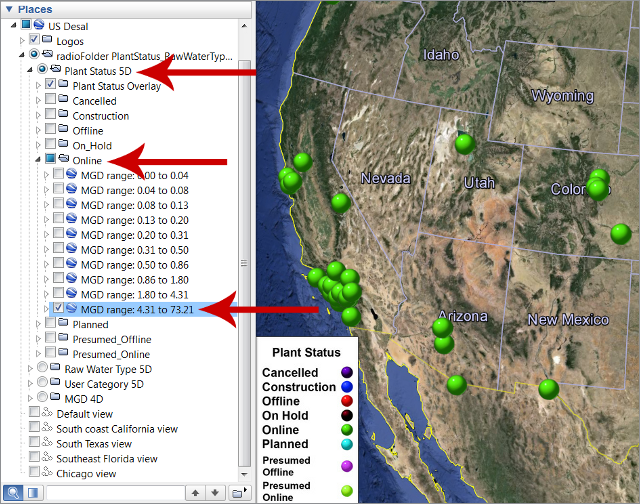
The last level of subfolders all have MGD sorted by size.
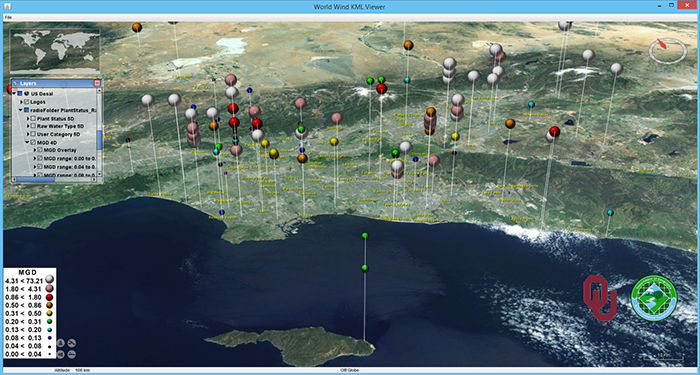
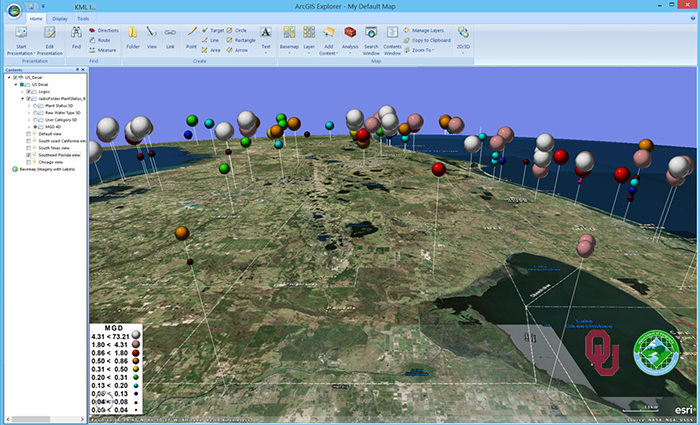
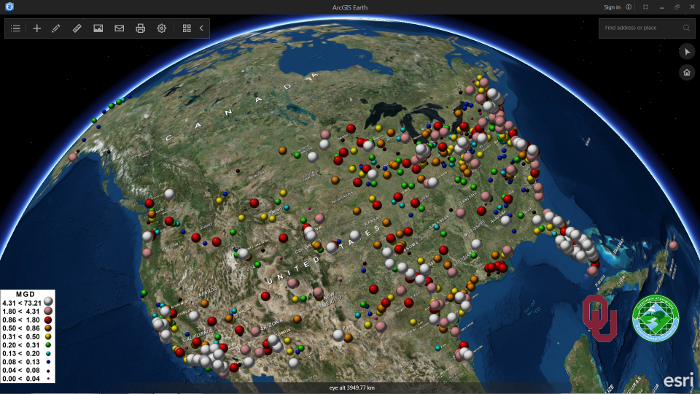
The map file US_Desal.kmz has been tested on Google Earth, NASA World Wind 2.0,
ArcGIS Explorer 3400, and ArcGIS Earth 1.0 but we recommend using
Google Earth for stability.
Below are 3 screen save examples of
NASA World Wind 2.0, ArcGIS Explorer 3400 and ArcGIS Earth 1.0.
Please note map US_Desal.kmz is for viewing and learning purposes only.
The map file US_Desal.kmz should not be used for anything else
without written permission from the authors Jad Ziolkowska or Reuben Reyes.
The US_Desal.kmz file is based on selected data from Desaldata.com.
This data was modified by the authors and made into a structured KMZ
map with permission from Desaldata.com. The code and example structures
in the KMZ file are free to use but not the data.
An iPhone with a view after loading US_Desal.kmz
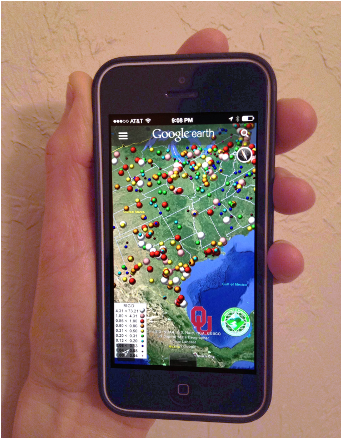
This will also work with Android devices.
We also tested KML files in Ceisum and the results were good and no need for plugins.
Below is one screen save from Cesium 1.16.
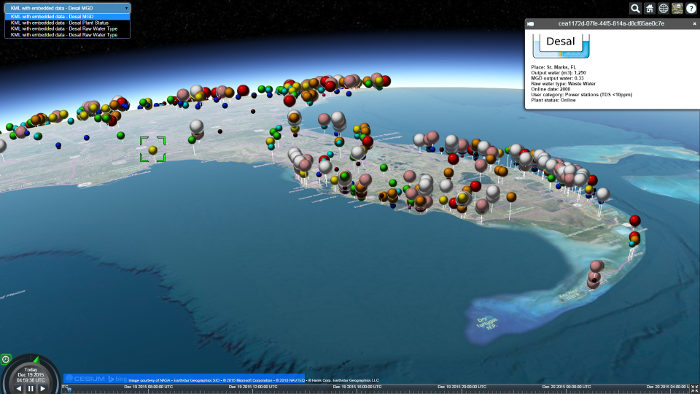
Experminental link in Cesium 1.16
Cesium Showcase History of Desalination Plants in the United States