Socioeconomic and weather correlations across 9 Oklahoma climate regions

This page provides supplemental information for OWRC Project 2020:

In the past decade, annually occurring extreme and exceptional droughts in Oklahoma have impacted up to 95% of the total state area (Drought Monitor,
2017) causing considerable economic losses in many sectors, especially agriculture (Stotts, 2011). Most studies assessing drought events focus on the
past and current meteorological, hydrological, and agricultural drought (Huang et al., 2017; Stagge et al., 2015; Awange et al., 2016). At the same time,
studies are scarce that would quantify economic repercussions of changing water availability and interactions between soil moisture and groundwater
resources on municipal, industrial and agricultural users in Oklahoma. This project aims to improve understanding of those interactions and their economic
impacts by developing a decision-support tool for sustainable water management at the state and at the Oklahoma climate region level.

To view the visualiztion below one will need Google Earth or some other virtual globe to view
this KMZ file. We recommend using Google Earth if you dont have it installed here is a link:
Click here for link to Google Earth for download and installation.

Click here for 3D OWRCproject2020.kmz
The OWRCproject2020.kmz file can also be examined in ArcGIS.


Below is a default view after loading map OWRCproject2020.kmz
default loaded screen view image of 9 climate regions

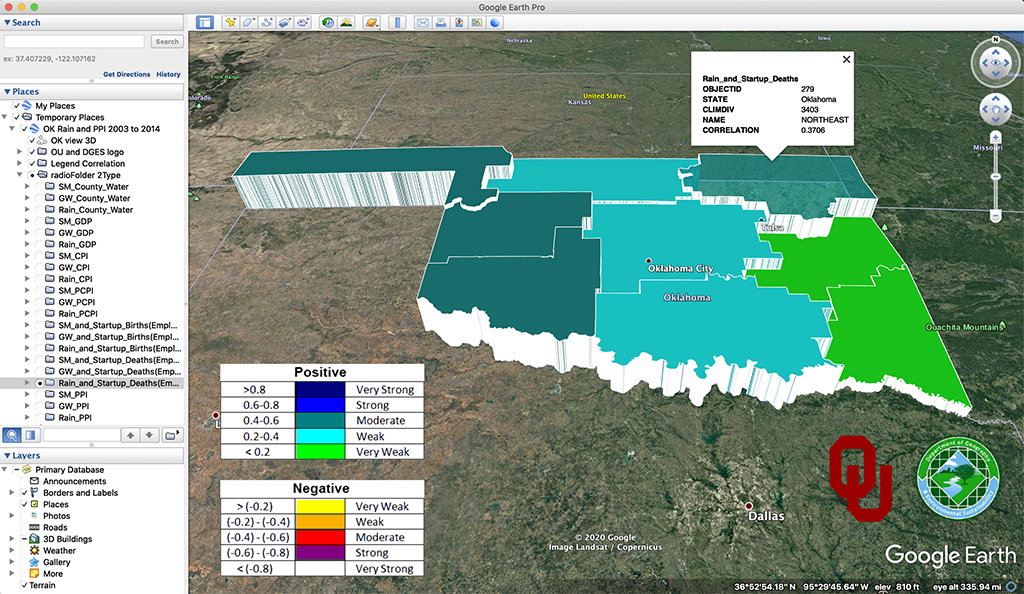
Regression correlations were processed across many variables.
Below is a list that correspond to Oklahoma climate regions visualization.

Soil Moisture (SM) vs County Water usage (County_Water)
Ground Water (GM) vs County Water usage (County_Water)
Radar Rain Estimations (Rain) vs County Water usage (County_Water)
Soil Moisture (SM) vs Gross Domestic Product (GDP)
Ground Water (GM) vs Gross Domestic Product (GDP)
Radar Rain Estimations (Rain) vs Gross Domestic Product (GDP)
Soil Moisture (SM) vs Consumer Price Index (CPI)
Ground Water (GM) vs Consumer Price Index (CPI)
Radar Rain Estimations (Rain) vs Consumer Price Index (CPI)
Soil Moisture (SM) vs Per Capita Personal Income (PCPI)
Ground Water (GM) vs Per Capita Personal Income (PCPI)
Radar Rain Estimations (Rain) vs Per Capita Personal Income (PCPI)
Soil Moisture (SM) vs Startup Births (Employment)
Ground Water (GM) vs Startup Births (Employment)
Radar Rain Estimations (Rain) vs Startup Births (Employment)
Soil Moisture (SM) vs Startup Deaths (Employment)
Ground Water (GM) vs Startup Deaths (Employment)
Radar Rain Estimations (Rain) vs Startup Deaths (Employment)
Soil Moisture (SM) vs Producer Price Index (PPI)
Ground Water (GM) vs Producer Price Index (PPI)
Radar Rain Estimations (Rain) vs Producer Price Index (PPI)

The interactive 3D map above shows both positive and negative correlations.

Research by
Dr. Jadwiga (Jad) R. Ziolkowska
Reuben Reyes
Shobey T. Stanley

References

Banerjee O, Bark R, Connor J, Crossman ND (2013): An ecosystem services approach to estimating economic losses associated with drought. Ecological Economics 91: 19-27

Carrão H, Naumann G, Barbosa P (2016): Mapping global patterns of drought risk: An empirical framework based on sub-national estimates of hazard, exposure and vulnerability. Global Environmental Change 39: 108-124

Dhorde AG, Patel NR (2016): Spatio-temporal variation in terminal drought over western India using dryness index derived from long-term MODIS data. Ecological Informatics 32: 28-38

Drought Monitor (2016): Drought severity index in Oklahoma in 2000-2016. The National Drought Mitigation Center: Lincoln, NE

Dumitraşcu M, Mocanu I, Mitrică B, Dragotă C, Grigorescu I, Dumitrică C (2017): The assessment of socio-economic vulnerability to drought in Southern Romania (Oltenia Plain). International Journal of Disaster Risk Reduction 27: 142-154

Fraser EDG, Simelton E, TermansenM, Gosling SN, South A (2013): “Vulnerability hotspots”: Integrating socio-economic and hydrological models to identify where cereal production may decline in the future due to climate change induced drought. Agricultural and Forest Meteorology 170: 195-205

Khayyati M, Aazami M (2016): Drought impact assessment on rural livelihood systems in Iran. Ecological Indicators 69: 850-858

Liu Z, Wang Y, Shao M, Jia X, Li X (2016): Spatiotemporal analysis of multiscalar drought characteristics across the Loess Plateau of China. Journal of Hydrology 534: 281-299

Musolino DA, Massarutto A, de Carli A (2018): Does drought always cause economic losses in agriculture? An empirical investigation on the distributive effects of drought events in some areas of Southern Europe. Science of The Total Environment 633: 1560-1570

NOAA (National Oceanic and Atmospheric Administration) (2016): National Temperature and Precipitation Maps. NOAA: Washington DC

OWRB (Oklahoma Water Resources Board) (2012): Oklahoma Comprehensive Water Plan. OWRB: Oklahoma City

Qureshi ME, Ahmad MD, Whitten SM, Kirby M (2014): A multi-period positive mathematical programming approach for assessing economic impact of drought in the Murray–Darling Basin, Australia. Economic Modelling 39: 293-304

Schumacher M, Forootan E, van Dijk AIJM, Müller Schmied H, Döll P (2018): Improving drought simulations within the Murray–Darling Basin by combined calibration/assimilation of GRACE data into the WaterGAP Global Hydrology Model. Remote Sensing of Environment 204: 212-228

Stotts D (2011): Oklahoma agricultural losses from drought more than $1.6 billion. Oklahoma State University Agricultural Communications Services: Stillwater, OK

Sun Z, Zhu X, Pan Y, Zhang J, Liu X (2018): Drought evaluation using the GRACE terrestrial water storage deficit over the Yangtze River Basin, China. Science of The Total Environment 634: 727-738

Thomas BF, Famiglietti JS, Landerer FW, Wiese DN, Molotch NP, Argus DF (2018): GRACE Groundwater Drought Index: Evaluation of California Central Valley groundwater drought. Remote Sensing of Environment 198: 384-392

Yaduvanshi A, Srivastava PK, Pandey AC (2015): Integrating TRMM and MODIS satellite with socio-economic vulnerability for monitoring drought risk over a tropical region of India. Physics and Chemistry of the Earth, Parts A/B/C 83-84: 14-27

Ziolkowska JR, Reyes R (2016): Geological and Hydrological Visualization Models for Digital Earth Representation. Computers & Geosciences 94: 31-39

Ziolkowska JR, Reyes R (2017): Groundwater Level Changes due to Extreme Weather - An Evaluation Tool for Sustainable Water Management. Water 9(2) 117


3D OWRC Project 2020 (Dec)