|
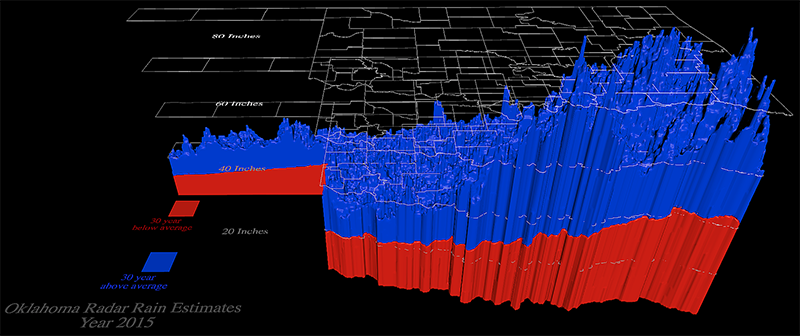
Visualization of radar rainfall estimates across the entire state of Oklahoma was conducted using a comparative analysis of one-year time intervals from 1995 to 2018. The data utilized in this visualization was obtained from the National Oceanic and Atmospheric Administration (NOAA). To facilitate quick identification of areas with below or above normal annual rainfall, a 30-year normal precipitation dataset was also incorporated. In this dataset, the color red indicates precipitation below the 30-year average, while the color blue represents precipitation above the average. The 30-year dataset, sourced from the National Centers for Environmental Information (NCEI), is included as gray and labeled as "30 Year Average".
The height or elevation in the above 25 independent interactive 3D models corresponds to the amount of rainfall in inches. Four horizontal county grids, divided into 20-inch intervals, serve as scales that can be selectively enabled or disabled. Each 3D map represents a specific year in Oklahoma and can be interactively explored. Since the dataset spans the years 1995 to 2018, it is considered a 4D dataset due to its temporal dimension.
The radar rainfall estimates originated from NOAA and encompassed the entire state of Oklahoma, sourced from the Arkansas-Red Basin River Forecast Center (ARBRFC). These estimates were processed at ARBRFC in hourly intervals and presented as a grid in Network Common Data Form (NetCDF), covering the entirety of Oklahoma. To generate a complete year's worth of data, approximately 8760 NetCFD hourly rainfall files per year was aggregated to create a 3D dataset.
The 30-year rainfall average was then gridded and used to categorize the yearly totals into two datasets: one represented by the color red, indicating below-average rainfall and potentially a drought year, and the other represented by the color blue, indicating above-average rainfall and potentially a flood year for the corresponding area.
Let's consider two illustrative examples. If we examine the data set for the year 2014, we observe predominantly red coloration, indicating that the entire state of Oklahoma experienced a drought during that period. Conversely, if we analyze the data set for the year 2015, we observe predominantly blue coloration, signifying that the state of Oklahoma encountered a flood due to the exceptionally high amount of rainfall it received throughout that year.
|